Weather Awareness at Sea
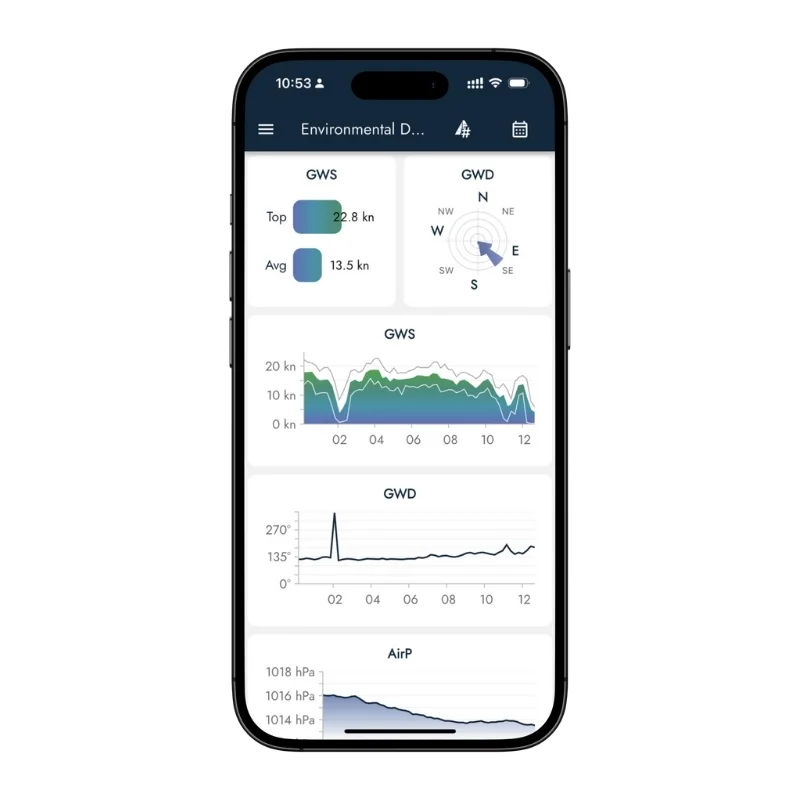
Barograph
Know what kind of weather system is headed your way.
Use the power of air pressure: With the Smartboatia Hub, you can detect weather changes early and make informed decisions on board – even without internet access.
Simple Section – In a Nutshell
- A barograph tracks atmospheric pressure to help you predict the weather.
- The Smartboatia App shows pressure trends, gives alerts, and helps you prepare – no guesswork needed.
- A sudden drop in pressure = a low is coming → expect strong winds.
- Onboard weather alerts with your marine barometer.
Sail Smarter
with the Digital Barograph
Atmospheric pressure is a key indicator of upcoming weather. For centuries, seafarers have used barographs to predict short-term weather changes. Especially when sailing off-grid, a barograph remains a reliable tool to avoid weather surprises.
The Smartboatia Hub comes with a built-in barometer.
Combined with the Smart Ship’s Log, it becomes a powerful digital barograph.
What the Smartboatia Barograph offers:
- Unlimited recording of atmospheric pressure
- Pressure trend analysis and warnings based on the past 1-hour and 3-hour pressure changes
built in Barometer
How it works
The Smartboatia Hub measures atmospheric pressure every minute using its integrated barometer.
It stores the data whenever a change is detected – but at least every 5 minutes.
The Smartboatia App displays the pressure history on a line chart, just like a traditional analog barograph – but it never runs out of paper.
You can select any time range to see pressure changes.
For example, a rapid drop in pressure means a low-pressure system is on the way – the steeper the drop, the stronger the expected winds.
Plus, the app gives visual alerts when the pressure changes significantly – a helpful starting point for your onboard weather assessment.
Alerts are currently based on standard meteorological knowledge.
We’re training the Smartboatia AI to deliver even better predictions by analyzing pressure changes, gusts, location, and more.
As with all Smart Ship’s Log data, you can access the barometer readings remotely via Smartboatia Cloud.
WHAT THEY MEAN
Pressure change indicators
| Change Type | Per Hour | Per 3 Hours | Meaning |
|---|---|---|---|
| Very fast increase | > +2 hPa | > +6 hPa | Fast-moving high-pressure system, possible wind burst |
| Fast increase | > +1.3 hPa | > +4 hPa | High-pressure area approaching |
| Moderate increase | ≤ +1.3 hPa | ≤ +4 hPa | Calm weather improvement |
| Stable | No significant change | Steady conditions | |
| Moderate decrease | ≤ -1 hPa | ≤ -3 hPa | Low-pressure system developing |
| Fast decrease | > -1 hPa | > -3 hPa | Strong low-pressure front with wind |
| Very fast decrease | > -2 hPa | > -6 hPa | Powerful low-pressure system with heavy wind |
Note: The impact on wind strength depends on your geographic location.
- For latitudes between 40° and 60° North:
- Fast pressure change: Winds of 6–8 Beaufort
- Very fast pressure change: Over 8 Beaufort
Why it matters on board!
Because the weather doesn’t always follow your plans.
When you’re offshore or out of range, modern weather apps stop working – but pressure never lies. The Smartboatia Barograph helps you detect changing weather patterns based on real-time pressure trends. Sudden drops? A low is coming. Sharp rises? High winds may follow. With Smartboatia as your AI-powered co-pilot, you gain early warnings, smarter decisions, and peace of mind – even without internet access. Whether you’re cruising, racing, or anchoring overnight: stay safe, stay informed.